Introduction
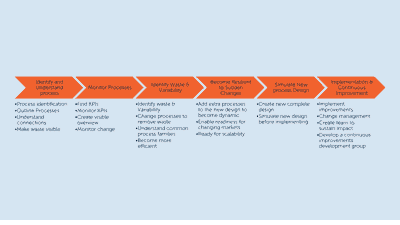
In today’s manufacturing and service operations, most companies make use of Key Performance Indicators (KPIs) to track performance, however, these KPIs often don’t provide the company with any beneficial outcome in terms of monitoring or insight into the company. This article, therefore, reveals some ideas on how to monitor your processes correctly by finding the right KPIs. This article is a part of the six-step “road map”, which is depicted in Figure 1.

Area to monitor
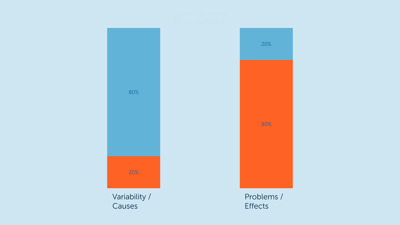
After having established a comprehensive process map, i.e., the first step of the roadmap, the processes must be monitored appropriately. To only focus on the most relevant area of optimization and monitoring, the Pareto Principle can be used. The Pareto Principle is useful to find the most beneficial areas to measure and change, which can be utilized to identify 80% of the effects/problems caused by 20% of the variability/causes[1] as illustrated in figure 2. By applying this principle correctly, the optimization and monitoring will thus focus on the area with the highest frequency of problem causes. This step may seem easy at first but is often a difficult and time-consuming step.

Hereafter, relevant, quantifiable, and outcome based KPIs must be identified. To do so and to fully utilize the KPIs, they must gather valuable insight and develop a goal-oriented culture within your company that aligns all relevant departments. The KPIs are often financial, customer-, or process-focused. But can be everything that the company finds important. KPIs tied to the financials typically focus on revenue and profit margins, however other focus areas might be the total cost of ownership or inventory holding costs. Examples of customer-focused KPIs could be to measure customer satisfaction or per-customer efficiency. The process-focused KPIs aims to measure and monitor operational performance and are what the rest of this article will focus on.
Process focused KPI's
There is multiple KPI’s to select from when monitoring processes, this section will describe only a few but very useful process focused KPI’s.
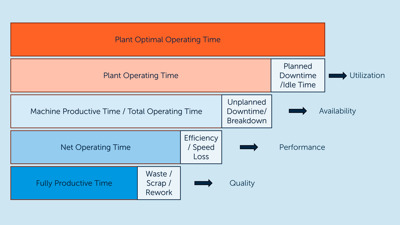
Overall Equipment Effectiveness (OEE) measures the effectiveness of operations equipment and therefore an interesting KPI in the eyes of process monitoring. OEE is based on three performance measures, i.e., the availability, performance, and quality of a system. The OEE is calculated by multiplying three metrics together, thus resulting in the productive time as a percentage of possible operating time[2] as depicted in figure 3.

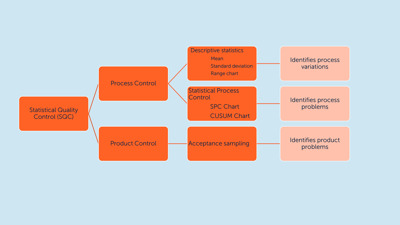
Statistical Quality Control (SQC) ensures that each output meets customer specifications the processes and the products. SQC can be divided into three categories: descriptive statistics, statistical process control (SPC) and acceptance sampling as depicted in figure 4.

Descriptive statistics describe quality characteristics and relationships among output parts. These include the mean, standard deviation, and a measure distribution of data.
Statistical process control is a control chart, plotting the output values against the order of collection and can therefore depict when a process is in control and illustrate when a process shifts out of control[3]. SPC is therefore a tool that can be used to monitor variability within manufacturing processes.
A Cumulative Sum (CUSUM) chart can be used to detect small shifts or trends more quickly than a regular control chart[4]. Looking for trends is an important use of SPC, as if the trend is steadily getting worse, the process will be worth investigating and vice versa, if the process seems to be improving, it will be beneficial to investigate what is making the process improve[5].
Acceptance sampling is the process of random inspecting a sample of finished goods or parts and deciding whether a batch should be accepted or rejected. Here, descriptive statistics are applied to e.g., describe the variability of observed data[6].
Throughput time represents the full time from a process begins to a product or service is finished or a customer is satisfied. The throughput time thereby incorporates multiple processes and can be useful to gain an overall picture of plant/service performance.
Monitor and track impact
When the KPIs are selected, one can then decide how to monitor and track the KPIs. When deciding how to monitor the KPIs, one must first identify and decide the data needs, method of tracing (manually or digitally) and the frequency of the measurements. When the relevant KPIs are identified and the monitoring method is set, the first baseline can be calculated. The baseline is used as a reference point, to further track impact and change. When monitoring KPIs it’s a good idea to somehow visualize them on a board or a screen. The method used is entirely up to the company and both have benefits. For example, the physical board visualization has the benefit of having someone taking ownership of the KPIs and thereby enabling fast escalation/action if the KPI doesn’t perform as predicted. Digital visualization has the benefit of not using resources on getting the KPIs on a board and can sometimes be beneficial when handling big data. The monitoring tool both physical and digital can, furthermore, work as a foundation for daily, weekly, and monthly status meetings, proven to be an extremely important tool for managers and leaders wishing to monitor change.
Actions / Tips & Tricks
- Understand all data when using the Pareto principle
- Stick to the simplest measuring method that fulfils the needs. It is often seen that manufacturers have decided to use a method that is complex and over-complicates the real value
- Make KPIs transparent for the workforce
- Evaluate internal competencies when deciding visualization method
Series of articles on process improvements
This is the fifth article in the series of ten.
- Potential Impact when Changing Processes
- Why Companies Should Focus on Optimizing Company Processes
- Roadmap on Redesigning a Company’s Processes to Enhance Competitiveness
Step 1 Identify and Understand your Processes
Step 2 Monitor your Processes
Step 3 Identifying Waste and Variability in your Processes
Step 4 Become Resilient to Sudden Changes
Step 5 Simulate your New Process Design
Step 6 Implementation and Continuous Improvement Process
The next article ‘Identify Waste and Variability in your Processes’ gives an insight into different types of waste and how identify variability.
[1] Slack et al. (2013). Operations Management. Pearson. (7th edition)
[2] Slack et al. (2013). Operations Management. Pearson. (7th edition)
[3] Steiner, S. H. and Mackay, R. J. (2005). Statistical Engineering – An Algorithm for Reducing Variation in Manufacturing Process. ASQ Quality Press.
[4] Montgomery, D. C. (2019). Introduction to Statistical Quality Control. John Wiley & Sons Inc
[5] Slack et al. (2013). Operations Management. Pearson. (7th edition)
[6] Slack et al. (2013). Operations Management. Pearson. (7th edition)


